

LEARN MORE about Nasdaq Dorsey Wright’s suite of relative strength separately/unified managed account strategies. DOWNLOAD our most recent performance report. ACCESS THE FREE 30-DAY TRIAL of the Nasdaq Dorsey Wright Research Platform.
The volatility in the fourth quarter of 2018, especially in December, sent many investors reeling; however, the month of January was a welcome reprieve from the selling pressure the market experienced at the end of last year. As a matter of fact, January 2019 saw a gain of 7.87% for the month, which is the fourth best January on record going back to 1950. There is an old market adage that suggests “As January goes, so goes the year,” which simply means that historically, a positive return in the month of January has generally been a positive sign for the market for the remainder of the year. Going back to 1950, when the S&P 500 Index has produced a gain in the month of January, it has recorded a gain for the full calendar year 88 percent of the time.
In addition to the positive return the market produced in January, a number of the market indicators we follow saw positive developments. One of the most notable of those indicators was the NYSE Bullish Percent (BPNYSE), an indicator that measures the percent of stocks on the New York Stock Exchange (NYSE) that are on Point & Figure buy signals. This Indicator fell to 16 percent back in December, the lowest level recorded since the 2008/2009 market bottom. On January 7, 2019, the BPNYSE initially reversed back into a column of X’s to put the offensive team back onto the field, and with the most recent action, the BPNYSE chart has rallied enough to exceed a previous top, changing its status to Bull Confirmed at 42 percent. A Bull Confirmed status is one of six risk levels that can be observed on bullish percent charts. It is the strongest of the six, and can be characterized as a “green light” for the market.
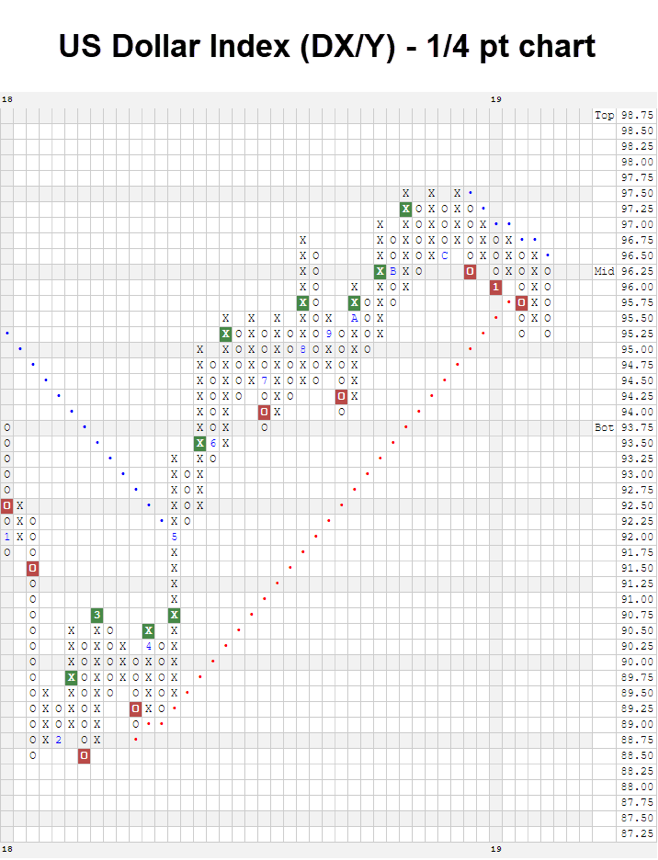
While the equity market regained solid footing during the start the year, the US dollar has recently returned to a negative near-term trend. 2018 was a positive year for the dollar, as it rallied more than 4 percent for the year and more than 10 percent off of its February 2018 lows. While the equity market was bottoming in December, the US Dollar Spot Index (DX/Y) formed notable resistance at the 97.50 level in November and December. A look at the quarter-point chart of the US dollar shows that on three occasions last fall it rallied to 97.50, but failed to penetrate that level. By early January, the US dollar had moved into a negative trend at 95.75, violating the trend line that extended back to March 2018.
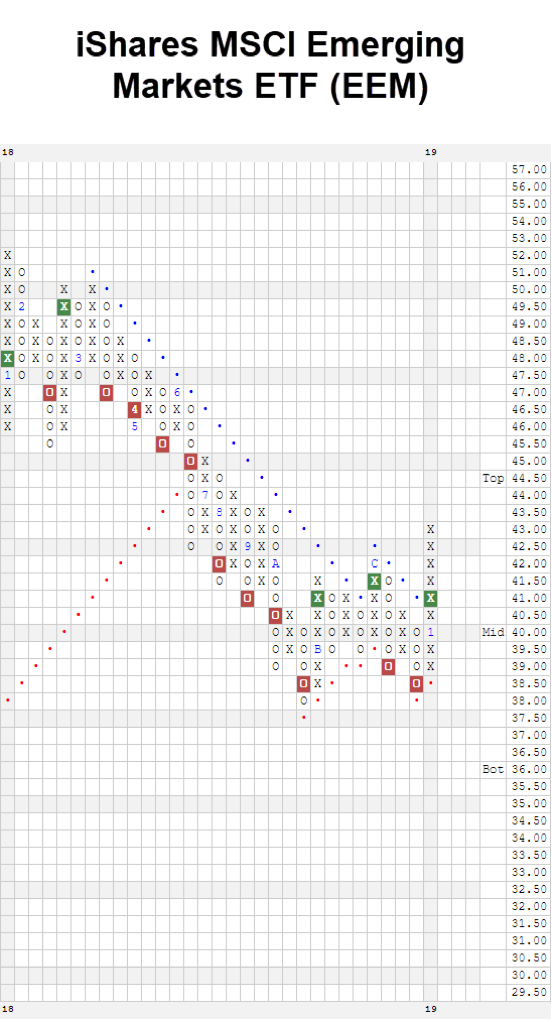
The recent movement of the dollar provides tailwinds for some areas of the market that were, for most of 2018, fighting stiff headwinds. In particular, international equities is one area of the global markets that tends to perform better when the dollar is weakening. A recent example of the tailwind generated by the weakening dollar is the iShares MSCI Emerging Markets ETF (EEM) which, after a 17% decline in 2018, has rallied 9.5% thus far in 2018 (through 2/1). More importantly, however, the trend chart of EEM has returned to a positive trend and has seen a surge in its technical fund score, which currently sits at an impressive 4.30 (out of a possible 6). All in all, the technical outlook for EEM, and emerging markets in general, has taken a turn for the better as we kick off 2019, while the US equity market has similarly regained solid footing.
About Nasdaq Dorsey Wright
Nasdaq Dorsey Wright has been an advisor to financial professionals worldwide for more than 30 years. Using Point & Figure Charting, Relative Strength Analysis, and numerous other tools, Nasdaq Dorsey Wright can help advisors analyze market data and deliver actionable insights to investors. Our research platform, SMA/UMA strategies, indexes, and team of analysts continue to help advisors build and protect client wealth by reducing the complexity of asset allocation and portfolio management. In particular our suite of separately/unified managed accounts follow a disciplined approach that seek to capitalize on long-term trends. Our investment universe and model constraints differ from strategy to strategy, resulting in different risk and return profiles. Download our most recent performance report here.
For More Information
- Click here to learn more about our suite of relative strength separately/unified managed account strategies.
- Click here for a free 30-day trial of the Nasdaq Dorsey Wright Research Platform
- For general info, visit www.business.nasdaq.com/dorsey-wright.
- Contact us directly.
Dorsey, Wright & Associates, LLC, a Nasdaq Company, is a registered investment advisory firm. Registration does not imply any level of skill or training.
Unless otherwise stated, the performance information included in this article does not include dividends or all potential transaction costs. Investors cannot invest directly in an index. Indexes have no fees. Past performance is not indicative of future results. Potential for profits is accompanied by possibility of loss.
Nothing contained within the article should be construed as an offer to sell or the solicitation of an offer to buy any security. This article does not attempt to examine all the facts and circumstances which may be relevant to any company, industry or security mentioned herein. We are not soliciting any action based on this article. It is for the general information of and does not constitute a personal recommendation or take into account the particular investment objectives, financial situations, or needs of individual clients. Before acting on any analysis, advice or recommendation (express or implied), investors should consider whether the security or strategy in question is suitable for their particular circumstances and, if necessary, seek professional advice.
Dorsey Wright’s relative strength strategy is not a guarantee. There may be times when all assets are unfavorable and depreciate in value. Relative Strength is a measure of price momentum based on historical price activity. Relative Strength is not predictive and there is no assurance that forecasts based on relative strength can be relied upon to be successful or outperform any index, asset or strategy.